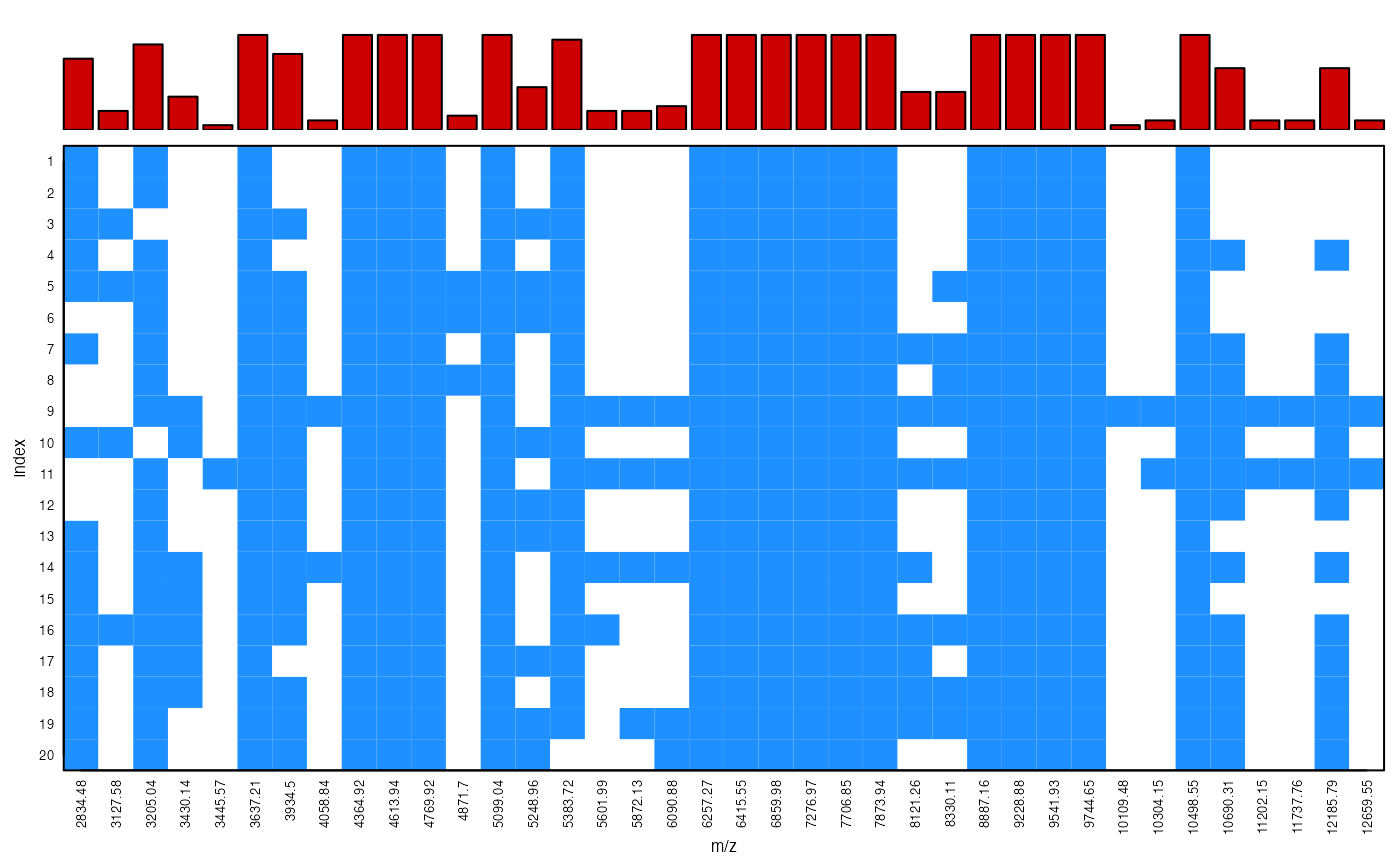
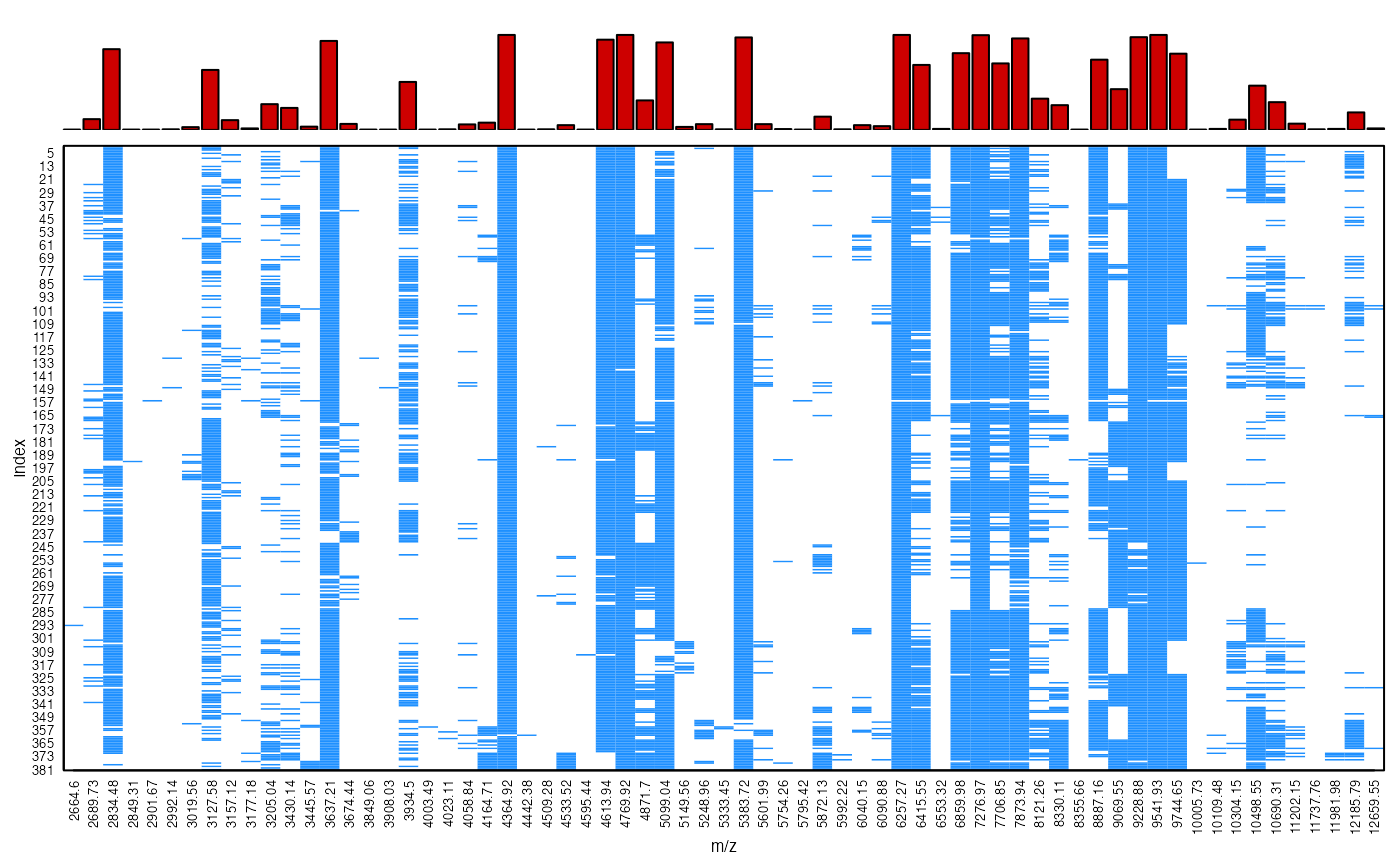
Display peak presence/absence patterns
peakPatterns.RdThis function displays the patterns of peak presence and absence in an intensity matrix as generated from intensityMatrix.
Arguments
- x
A
matrix,data.frameor a list ofMassPeaksobjects.- abs.lab
Unique label used to denote peak absence in
x(NA, default).- barplot
Logical value indicating whether a barplot of relative peak frequency across samples is displayed (
TRUE, default).- axis.lab
Vector of axis labels in the
c("x", "y")format.- bar.col
Colour of the bars in the barplot.
- cell.col
Vector of colours for the table cells (format
c("col.absence","col.presence")).- grid
Logical value indicating whether gridlines are added (
FALSE, default).- grid.col
Colour of the gridlines (
"black", default).- grid.lty
Style of the gridlines (
"dotted", default. Seeltyinpar).- cex.axis
Axis tick labels scaling factor relative to default.
- cex.lab
Axis labels scaling factor relative to default.
- ...
Other arguments.
Details
The peak presence/absence patterns are displayed by rows from the first (top) to the last (bottom) sample in the data set x over the range of common m/z points. Positive peaks are by default represented by coloured cells whereas zero or absent peaks are left blank. A barplot on the top margins shows the relative frequency of a peak at each m/z point across samples.
Value
No return value, graphical output.
See also
See intensityMatrix.
Examples
# Load example data

data(spectra) # list of MassSpectra class objects
data(type) # metadata

# Some pre-processing

sc.results <- screenSpectra(spectra,meta=type)
spectra <- sc.results$fspectra # filtered mass spectra
type <- sc.results$fmeta    # filtered metadata
spectra <- transformIntensity(spectra, method = "sqrt")
spectra <- wavSmoothing(spectra)
spectra <- removeBaseline(spectra)
peaks <- detectPeaks(spectra)
peaks <- alignPeaks(peaks, minFreq = 0.8)

# Display patterns across all data

peakPatterns(peaks)


# Check results within isolate 280

peakPatterns(peaks[type$Isolate=="280"])
# Check results within isolate 280
peakPatterns(peaks[type$Isolate=="280"])