Identification of potentially low-quality raw mass spectra
screenSpectra.RdThis function implements a quality control check to help in the identification of possibly faulty, low-quality raw mass spectra. It computes an atypicality score and labels suspicious profiles for further inspection and filtering.
Arguments
- x
A list of
MassSpectrumobjects.- meta
(optional) Matrix or vector containing metadata associated to
x. Typically a data matrix including spectrum ID, biotype, replicate number, etc. for each element ofx.- threshold
Multiplicative factor used in computing the upper and lower fences to determine passes and failures. It is related to the actual method used to compute the fences (see
method). Typically,threshold = 1.5(default value) for the boxplot rules, andthreshold = 3for the others.- estimator
Robust scale estimator used:
Q: robust location-free scale estimate (default, seeQnfunction inrobustbasepackage). More efficient than MAD and adequate for non-symmetric distributions.MAD: median absolute deviance scale estimate. Very robust and preferred for fairly symmetric distributions.- method
Method used to compute upper and lower fences for the identification of atypical mass spectra.
boxplot: standard boxplot rule based on the first and third quartiles and the interquartile range.adj.boxplot: extension of boxplot rule for strongly asymmetric data (default).ESD: extreme studentized deviation method. Based on the mean and the standard deviation of the data. Typically used withthreshold = 3(three-sigma rule).Hampel: robust version of the ESD method based on the median and the median absolute deviance estimate (MAD).RC: as Hampel's but replacing MAD by Rousseeuw & Croux (1993)'sQnas scale estimate.- nd
Order for the derivative function of the mass spectra (default = 1).
- lambda
Weight given to each component of the atypicality score (values in [0, 1], default = 0.5, see details below).
- ...
Other arguments.
Details
The procedure computes an atypicality score (A score) based on a weighted function of two components: (1) a robust scale estimator (Q or MAD) of the n-order derivative (computed using Savitzky-Golay smoothing filter) of scaled mass spectra and (2) the median intensity of the signals. Given a method to determine tolerance fences, a mass spectrum is labelled as potentially faulty, low-quality according to the magnitude of its A score. The adj.boxplot method based on the Q scale estimator and equal weights to both components (lambda = 0.5) are the default options. The greater lambda the higher the weight given to the scale estimator in the A score. The function produces summaries and a list of mass spectra and (if given) associated metadata in which the identified cases were filtered out.
Value
An object of class scSpectra with elements:
- fspectra
List of mass spectra (
MassSpectrumclass) with potential low-quality cases filtered out.- fmeta
Associated filtered metadata (
data.frameobject).- est.table
Results table showing the mass spectra ID, A score and label (pass/failure).
- ...
Other details (see method
summary.scSpectraforscSpectraobjects).
See also
See methods summary.scSpectra and plot.scSpectra for scSpectra objects.
Examples
# Load example data
data(spectra) # list of MassSpectra objects
data(type) # metadata
# Results using different settings
sc.results <- screenSpectra(spectra)
sc.results <- screenSpectra(spectra, type)
sc.results <- screenSpectra(spectra, type, method = "RC")
sc.results <- screenSpectra(spectra, type, threshold = 3, estimator = "MAD", method = "Hampel")
# Numerical and graphical summary
summary(sc.results)
#> (10 first mass spectra)
#> ID A score Class
#> 1 160408F21 0.1533490 success
#> 2 160408F22 0.1558803 success
#> 3 160408F23 0.1736287 success
#> 4 160408F24 0.1352231 success
#> 5 160408G01 0.1349331 success
#> 6 160408G02 0.1602482 success
#> 7 160408G03 0.1628105 success
#> 8 160408G04 0.1421277 success
#> 9 160408G05 0.1578878 success
#> 10 160408G06 0.1437707 success
#>
#> ----------------------------
#>
#> Scale estimator: MAD
#> Method: Hampel
#> Threshold: 3
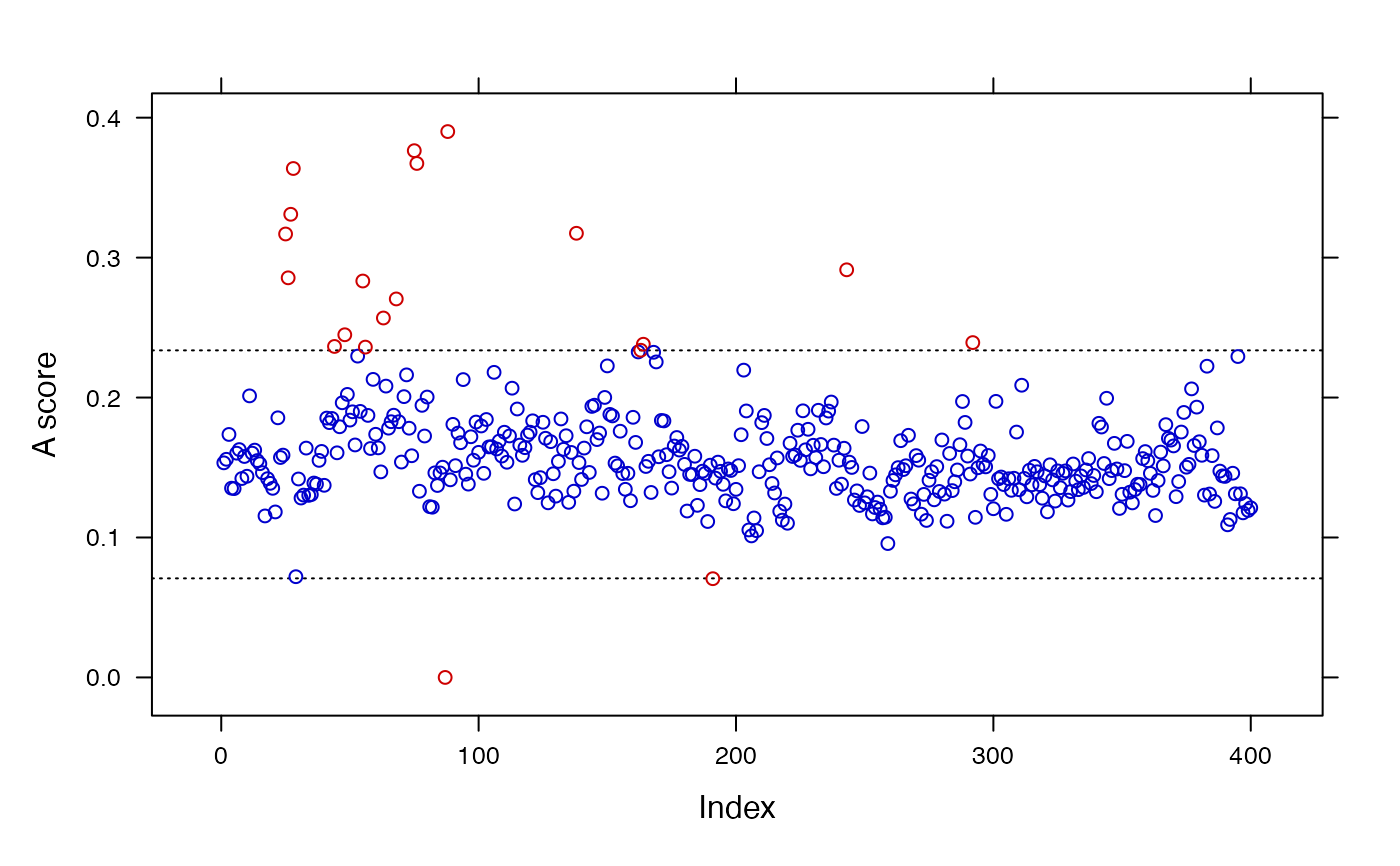
#> Limits: [0.0708,0.2337]
#> Deriv. order: 1
#> Lambda: 0.5
#> No. potentially faulty spectra: 20 (5 %)
plot(sc.results)
 # Save filtered data for further pre-processing
filtered.spectra <- sc.results$fspectra
filtered.type <- sc.results$fmeta
# Save filtered data for further pre-processing
filtered.spectra <- sc.results$fspectra
filtered.type <- sc.results$fmeta