Graphical summary of screenSpectra objects
plot.scSpectra.RdThis is a plot method for scSpectra objects that displays the results from applying screenSpectra to identify potential faulty, low-quality raw mass spectra.
Arguments
- x
A
scSpectraobject as generated byscreenSpectra.- type
Type of graphical display.
- breaks
Number of break points for plotting a histogram when
type = "hist"(default = 30).- labels
Vector of labels for the mass spectra (default =
FALSE, no labels).- col
Colour for the histogram bars when
type = "hist".- ...
Other arguments.
Details
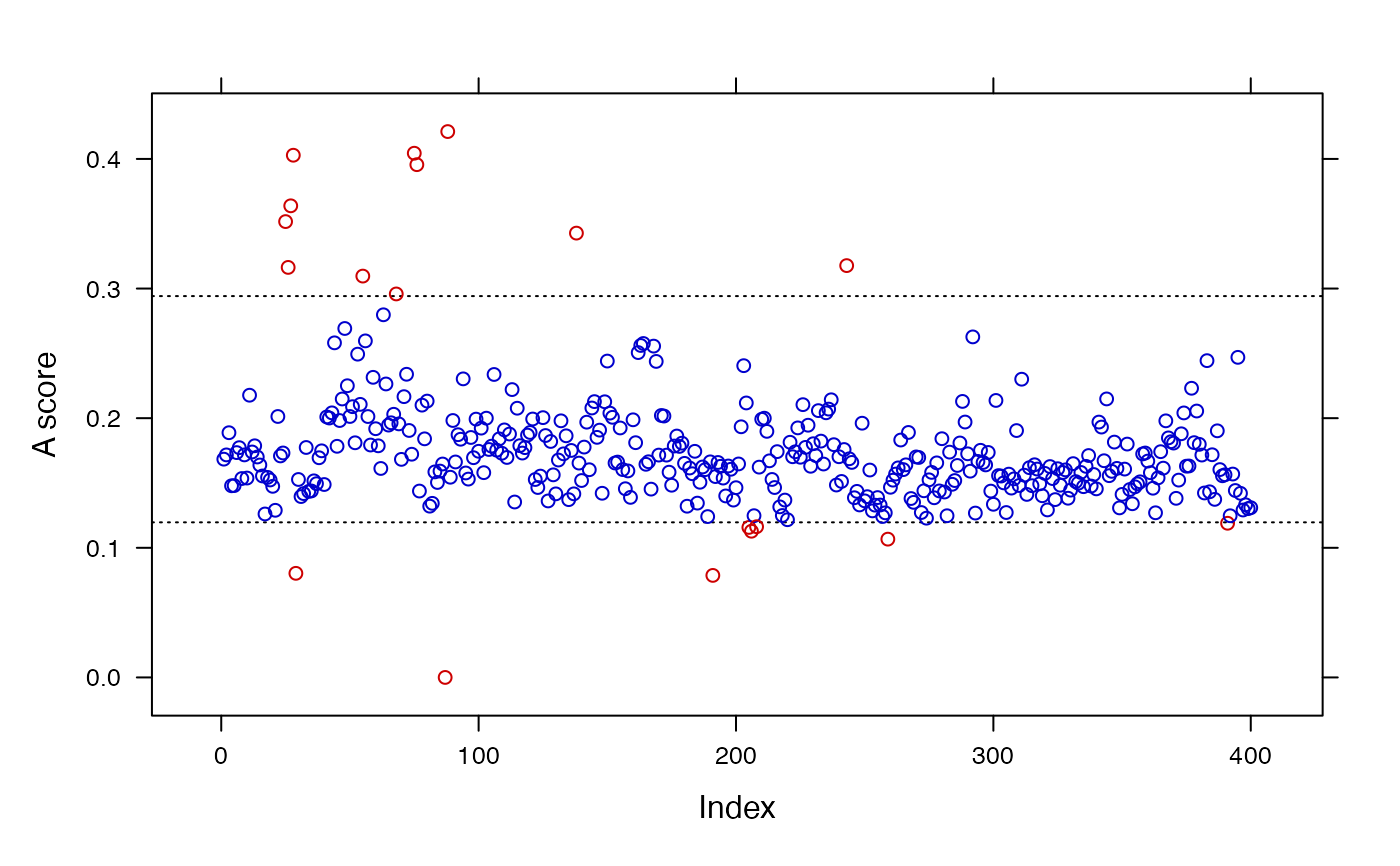
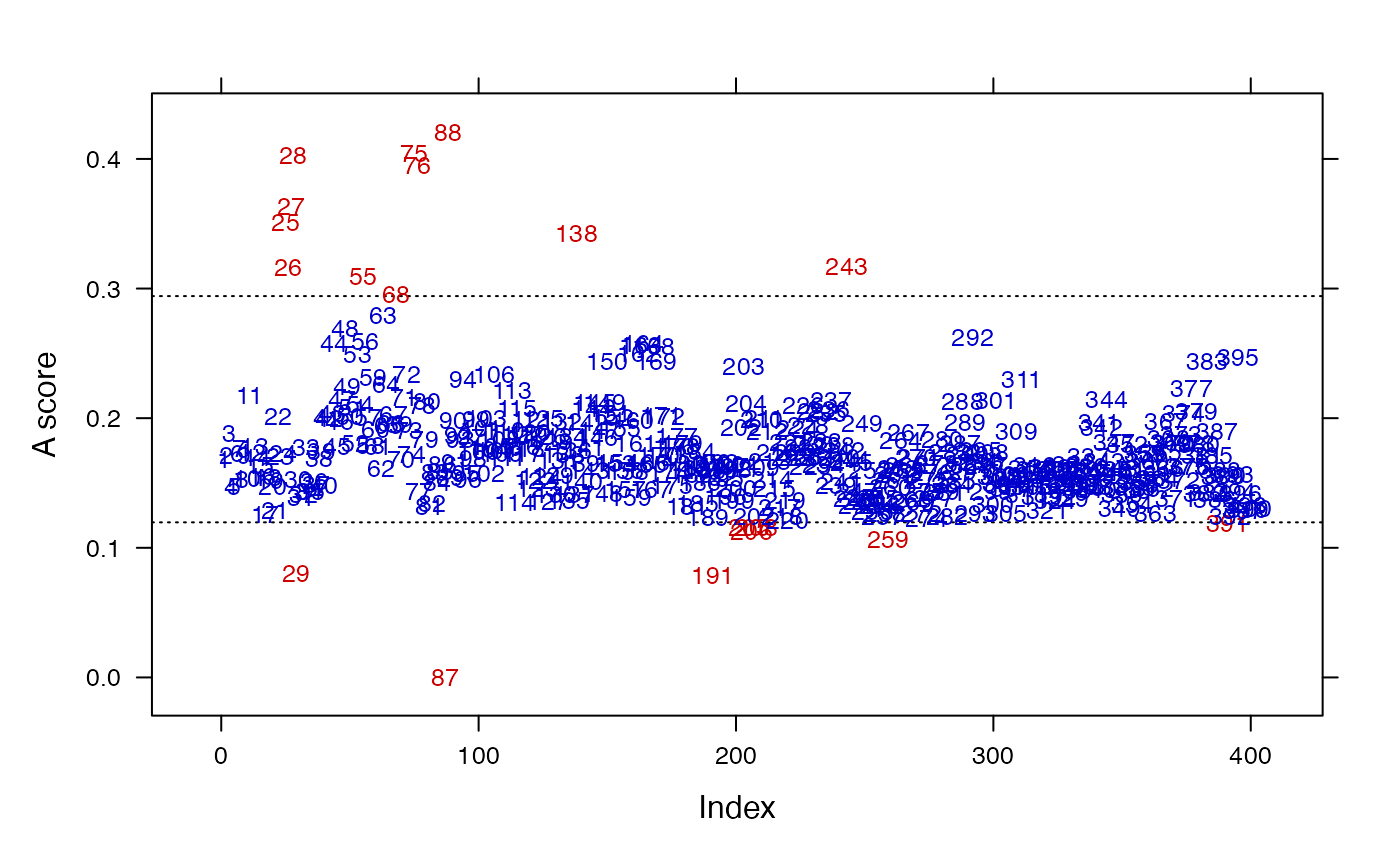
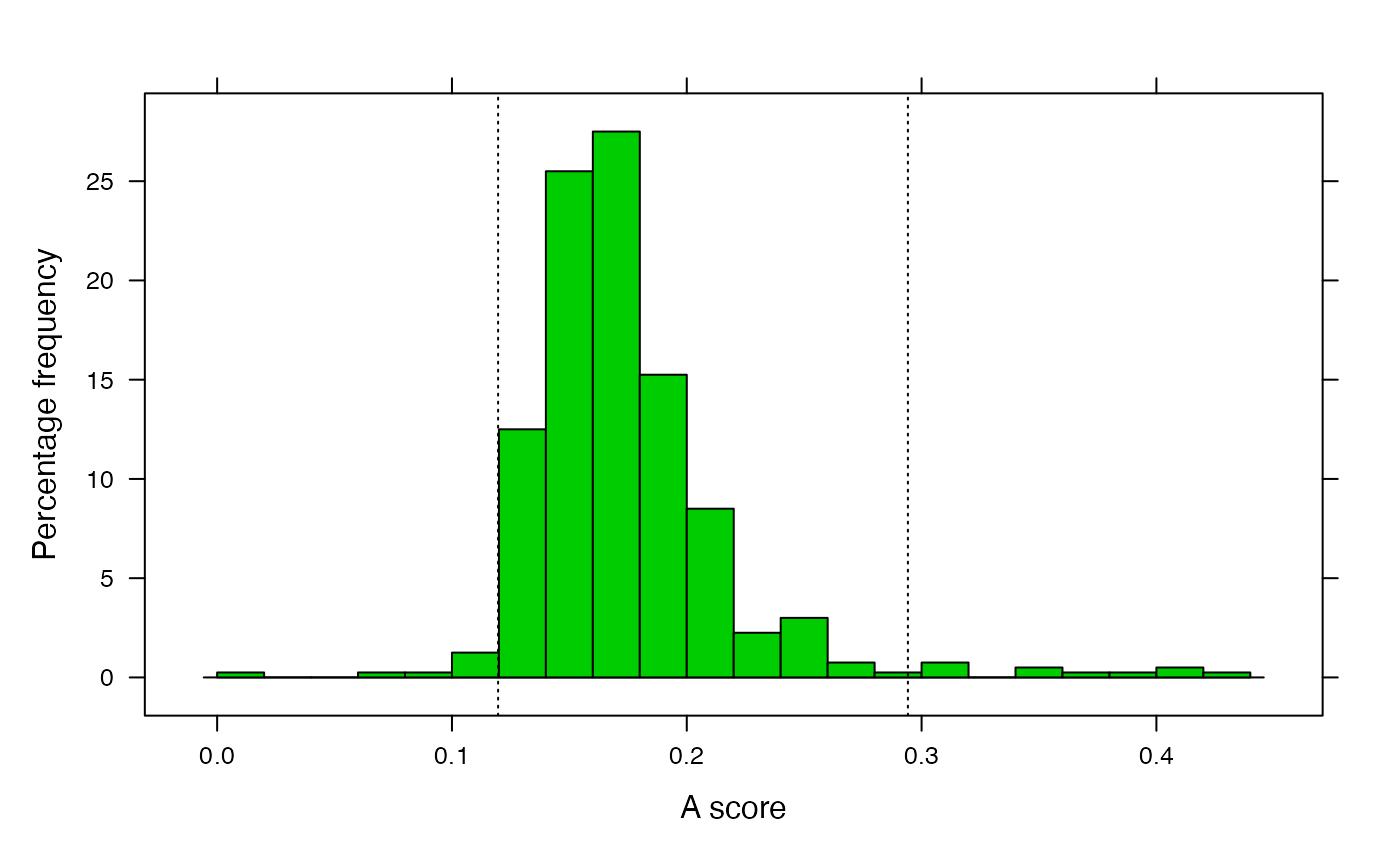
For type = "index" (default) the upper and lower fences used to declare a mass spectrum as potentially low-quality are shown along with their A scores (see screenSpectra for details). Point labels can be added using the labels argument (either a position index when labels = TRUE or a given vector of labels; see examples below). For type = "hist" a histogram of the distribution of the A scores is produced along with the tolerance fences. Finally, type = "casewise" displays interactively the flagged spectra for visual inspection.
Value
No return value, graphical output.
See also
See screenSpectra and summary.scSpectra.